
Flow-based DDoS Detection and RTBH
Network telemetry is still one of the quickest and most effective ways to spot security threats, from distributed denial-of-service attacks and data exfiltration to lateral movement and botnet activity.
DDoS attacks are now a constant - a sector overview puts the total at around 47.1 million attacks in 2025, roughly 1.5 every second, with the largest recorded attack reaching 31.4 Tbps (StationX, 2026). The same overview puts DDoS downtime at a cost of $22,000 per minute and it’s frequently used in geopolitical conflicts by hacktivist and state-sponsored groups. This is a real weapon that attackers are using today.
Service providers carry an even worse burden. An attack aimed at one customer still has to cross the provider's transit links to reach them and those links are shared. While one customer is being targeted, everyone else on the same uplinks is competing for the remaining bandwidth.
The Network Operations Centre (NOC) is under pressure to react fast but each option has a cost. A blackhole on all traffic would just finish the attacker’s job for them and lifting the blackhole too soon would bring the attacker straight back which is what happened in this lab. At the end of the day, customers remember outages not attacks.
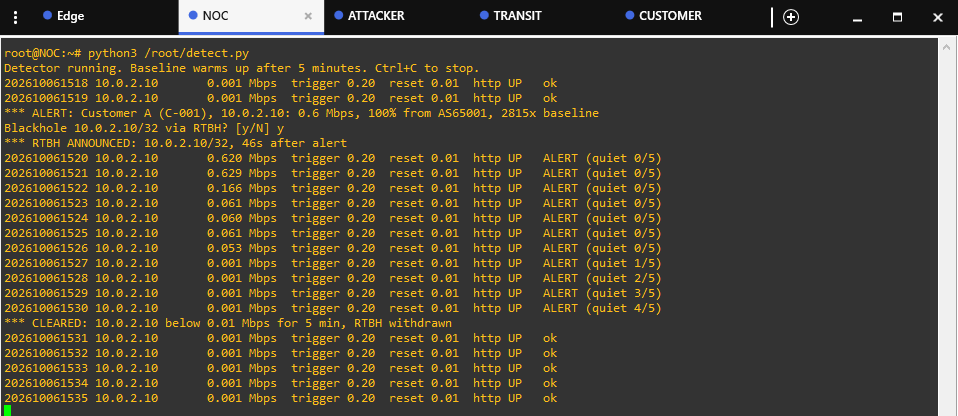
A DDoS attack blackholed, successfully
How it works
~
How it works ~
Using nfdump for Telemetry
nfdump is a free, open-source set of tools for collecting and analysing flow data (NetFlow, IPFIX and sFlow) which are summaries routers send about the traffic passing through them. There are two main parts to it: nfcapd, which receives and stores the records and nfdump which queries them.
Telemetry becomes really useful when it shows you the traffic itself. Where it's coming from, where it's going, which protocols make up the volume and whether the path between source and destination is stable or efficient.
Using ExaBGP for Translation
Described as the BGP Swiss Army Knife of Networking, ExaBGP is a BGP implementation designed to enable network engineers and developers to interact with BGP networks using Python scripts or external programs via a simple API.
Unlike normal routing software, ExaBGP doesn't move any traffic. It just passes messages between programs and routers.
Under the hood
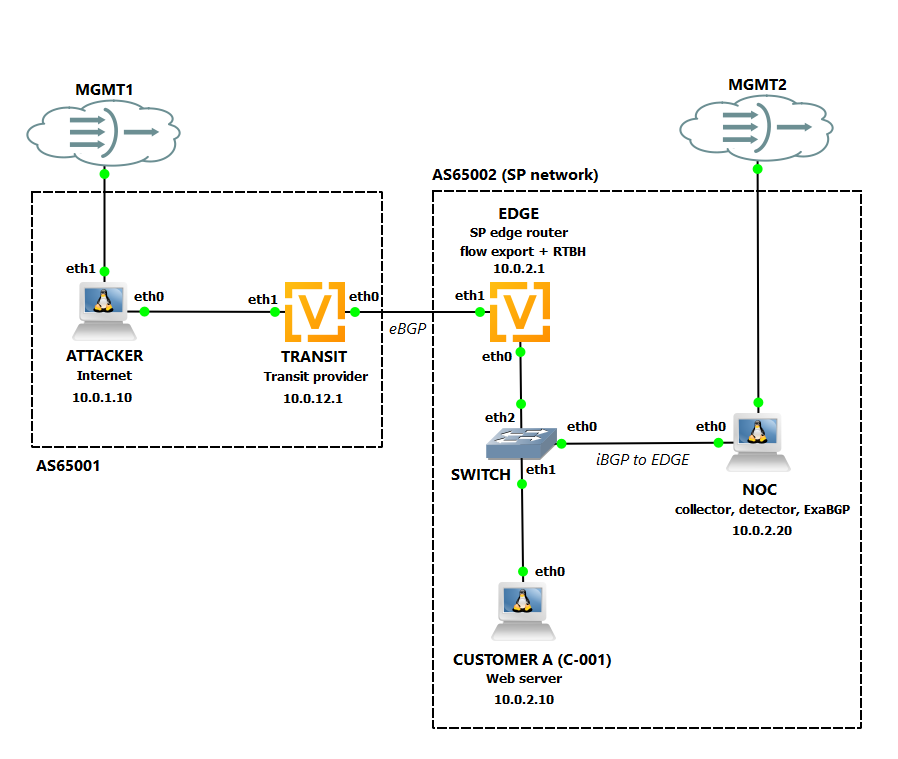
The detector is written in Python and runs on a virtual Ubuntu container in GNS3 just like my Rogue DHCP Server Detector.
Every minute, EDGE (running a VyOS router) exports flow records and this function asks nfdump to total the bytes sent to each destination. SAMPLE_RATE scales the numbers back up if the router only samples some of the packets. It's set to 1 here but without it, every figure on a network would be wrong.
The lookup tables give the targeted IP addresses an identity and show which autonomous system (AS) the traffic is coming from.
Baseline for what normal looks like for each customer. The average traffic and how much it usually varies (the standard deviation, sigma or σ) over the last 30 minutes. Note: a steady customer has a small σ and a busy, spiky one has a large σ.
Each minute, the detector compares traffic against each of the customer’s own threshold and learns each customer’s ‘resting heart rate’. It takes note of its variance and only raises the alarm when traffic jumps beyond it’s ‘resting rate’.
Once the attack is presumed to be over, the detector checks every minute that it goes quiet. If the traffic being received is below the reset level, 1 will be added to the quiet counter. If the traffic is above it, the counter will be reset. After 5 quiet minutes, the blackhole is withdrawn.
What I discovered between v1.0 and v1.1 was that the attacker was still launching the attack. In v1.0 the reset level was set too high for this customer so when the attack slowed down under the blackhole, the detector decided it was over and lifted the blackhole while the attacker was still sending. This is the most crucial and, in hindsight, the most obvious line of the detector.
Run 1 (v1.0) attack
Strictly speaking, this is a denial-of-service (DoS) attack but detection and remotely triggered black hole (RTBH) treat it the same way they would a distributed flood, by total traffic to the customer not by source.
Calm before the storm. Constant background ping run from TRANSIT to 10.0.2.10 (CUSTOMER) establishes baseline
Flood attack from ATTACKER (ping -f 10.0.2.10) intiated and detected by the script. Displays who’s being attacked, from where and how much (298x above baseline)
User/operator then decides whether to intiate blackhole. If yes, an RTBH is annouced which comes less than a minute before but you’ll see this number improve in v1.1,
The traffic is still visible on the EDGE, flow is measured per minute before the drop.
After the third minute of detection, the traffic falls below reset level and the quiet counter starts.
The output says 'CLEARED’ yet there’s still traffic…
What went wrong
The command is investigating who was sending traffic to the customer between 12:24 and 12:28, when the detector said it was quiet
10.0.1.10 (ATTACKER): 1.7 MB, 99.1%. Highlighted in red, attacker never stopped.
10.0.12.1 (TRANSIT): 0.9%. The background ping.
Run 2 (v1.1) attack
Same story as Run 1 but with the reset calculation above which bases it on the customer's own traffic instead of the alert threshold. As you can see, the blackhole held for the attack and cleared only once the attack had stopped (stopping flood ping on ATTACKER terminal)
Alert is activated, this time the traffic is 4683x above the baseline
RTBH announced, 11s after the alert
The slowed attack at 0.060, quiet 0/5
One minute here reads 0.120 Mbps. Two of EDGE's 60s exports landed in the same one minute collector file. The detector was unaffected since the count only cares whether traffic is below the reset level. Blackhole held on.
The flood is stopped, traffic drops to 0.001 Mbps and the quiet count finally starts.
Cleared after five quiet minutes
Back to normal with TRANSIT's ping
Same command run during it’s quiet minutes
100% came from 10.0.12.1, TRANSIT's normal ping. The attacker is gone. TRANSIT sent the same 14,868 bytes as in Run 1's quiet window, but this time there's nothing else, so the quiet minutes really were quiet
Putting it all together
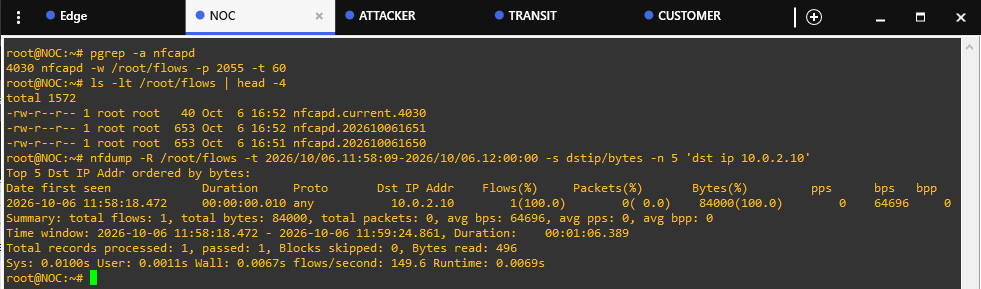
nfcapd stores the flows, nfdump reads them back. 1,000 pings x 84 bytes = 84,000 bytes

Once an alert is approved at the script’s prompt, the detector writes one line
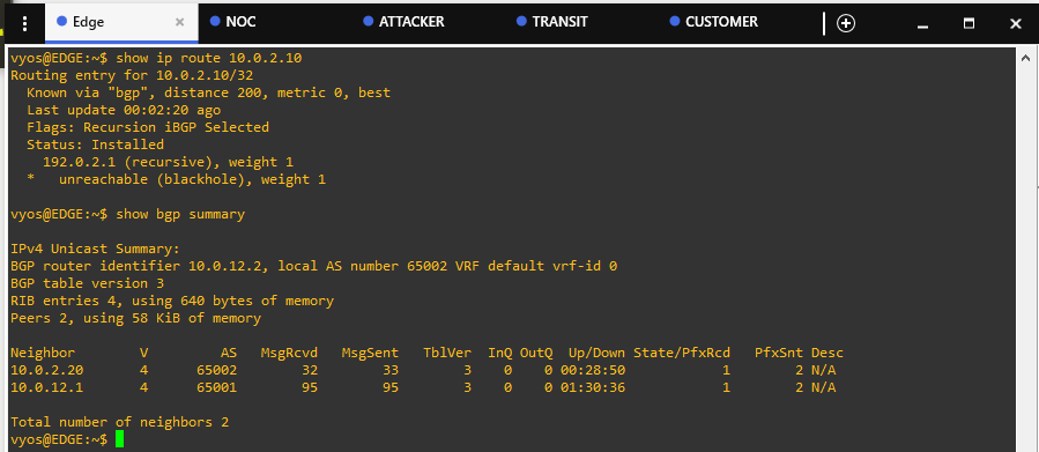
Edge receives 10.0.2.10/32 from ExaBGP, follows the next hop 192.0.2.1 to the blackhole and drop the traffic
def flows(path, agg, filt=None):
    """Bytes per address from one nfcapd file, sampling-corrected."""
    field = "%da" if agg == "dstip" else "%sa"
    cmd = ["nfdump", "-r", path, "-q", "-N", "-A", agg, "-o", f"fmt:{field} %byt"]
    if filt:
        cmd.append(filt)
    out = subprocess.run(cmd, capture_output=True, text=True).stdout
    res = {}
    for line in out.splitlines():
        p = line.split()
        if len(p) == 2 and p[1].isdigit():
            res[p[0]] = res.get(p[0], 0) + int(p[1]) * SAMPLE_RATE 1
    return res

CUSTOMERS = {ipaddress.ip_network("10.0.2.0/24"): ("Customer A", "C-001")} 2
ORIGIN_AS = {ipaddress.ip_network("10.0.1.0/24"): 65001,
             ipaddress.ip_network("10.0.12.0/30"): 65001,
             ipaddress.ip_network("10.0.2.0/24"): 65002}

def baseline(dst): 3
    n, mean, sq = db.execute(
        """SELECT COUNT(*), AVG(bps), AVG(bps*bps) FROM
           (SELECT bps FROM minutes WHERE dst=? AND in_alert=0
            ORDER BY ts DESC LIMIT ?)""",
        (dst, BASELINE_MINUTES)).fetchone()
    if not n:
        return 0, 0.0, 0.0
    return n, mean, math.sqrt(max(sq - mean * mean, 0))

bps = byts * 8 / INTERVAL
n, mean, sd = baseline(dst)
trigger = max(mean + SIGMA * sd, MIN_BPS) if n >= MIN_SAMPLES else MIN_BPS 4
st = alerts.get(dst)
...
elif st is not None:
    st["quiet"] = st["quiet"] + 1 if bps < reset else 0 5
    if st["quiet"] >= RESET_MINUTES:
        if st["blackholed"]:
            bgp(f"withdraw route {dst}/32 next-hop {BLACKHOLE_NH}")
        log_event(dst, "CLEARED", ...)
        del alerts[dst]

- reset = max(RESET_FACTOR * mean, MIN_BPS / 2) 6
+ reset = max(mean + SIGMA * sd, RESET_FACTOR * mean, 10_000)
root@NOC:~# python3 /root/detect.py
Detector running. Baseline warms up after 5 minutes. Ctrl+C to stop.
202610061219 10.0.2.10       0.001 Mbps  trigger 0.20  reset 0.10  http UP   ok 1
*** ALERT: Customer A (C-001), 10.0.2.10: 0.6 Mbps, 100% from AS65001, 298x baseline 2
Blackhole 10.0.2.10/32 via RTBH? [y/N] y
*** RTBH ANNOUNCED: 10.0.2.10/32, 33s after alert 3
202610061220 10.0.2.10       0.609 Mbps  trigger 0.20  reset 0.10  http UP   ALERT (quiet 0/5) 4
202610061221 10.0.2.10       0.616 Mbps  trigger 0.20  reset 0.10  http UP   ALERT (quiet 0/5)
202610061222 10.0.2.10       0.263 Mbps  trigger 0.20  reset 0.10  http UP   ALERT (quiet 0/5)
202610061223 10.0.2.10       0.061 Mbps  trigger 0.20  reset 0.10  http UP   ALERT (quiet 1/5) 5
202610061224 10.0.2.10       0.061 Mbps  trigger 0.20  reset 0.10  http UP   ALERT (quiet 2/5)
202610061225 10.0.2.10       0.061 Mbps  trigger 0.20  reset 0.10  http UP   ALERT (quiet 3/5)
202610061226 10.0.2.10       0.061 Mbps  trigger 0.20  reset 0.10  http UP   ALERT (quiet 4/5)
*** CLEARED: 10.0.2.10 below 0.10 Mbps for 5 min, RTBH withdrawn 6
202610061227 10.0.2.10       0.061 Mbps  trigger 0.20  reset 0.10  http UP   ok
root@NOC:~#
The detector declared the attack was over and withdrew the blackhole. Why is there still 0.061 Mbps of traffic hitting the customer?
root@NOC:~# nfdump -R /root/flows -t 2026/10/06.12:24:00-2026/10/06.12:28:00 -s srcip/bytes -n 5 'dst ip 10.0.2.10'1
Top 5 Src IP Addr ordered by bytes:
Date first seen             Duration     Proto       Src IP Addr    Flows(%)     Packets(%)       Bytes(%)         pps      bps   bpp
2026-10-06 12:24:13.045     00:00:00.226 any           10.0.1.10        4(57.1)        0( 0.0)    1.7 M(99.1)2        0    60036     0
2026-10-06 12:24:37.320     00:00:00.180 any           10.0.12.1        3(42.9)        0( 0.0)    14868( 0.9)3        0      660     0
Summary: total flows: 7, total bytes: 1.7 M, total packets: 0, avg bps: 60560, avg pps: 0, avg bpp: 0
Time window: 2026-10-06 12:24:00.  0 - 2026-10-06 12:28:00.  0, Duration:    00:04:00.000
Total records processed: 7, passed: 7, Blocks skipped: 0, Bytes read: 3524
Sys: 0.0043s User: 0.0011s Wall: 0.0027s flows/second: 2571.6 Runtime: 0.0028s
root@NOC:~#
reset = max(mean + SIGMA * sd, RESET_FACTOR * mean, 10_000)Base the reset level on the customer’s own traffic and a 10 kbps floor
root@NOC:~# nfdump -R /root/flows -t 2026/10/06.13:53:00-2026/10/06.13:57:00 -s srcip/bytes -n 5 'dst ip 10.0.2.10'1
Top 5 Src IP Addr ordered by bytes:
Date first seen             Duration     Proto       Src IP Addr    Flows(%)     Packets(%)       Bytes(%)         pps      bps   bpp
2026-10-06 13:53:06.870     00:00:00.180 any           10.0.12.1        3(100.0)        0( 0.0)    14868(100.0)2        0      659     0
Summary: total flows: 3, total bytes: 14868, total packets: 0, avg bps: 659, avg pps: 0, avg bpp: 0
Time window: 2026-10-06 13:53:00.  0 - 2026-10-06 13:57:00.  0, Duration:    00:04:00.000
Total records processed: 3, passed: 3, Blocks skipped: 0, Bytes read: 2604
Sys: 0.0084s User: 0.0012s Wall: 0.0062s flows/second: 484.8 Runtime: 0.0062s
root@NOC:~#
In v1.0 the blackhole came off while the attack was still going, and the customer got hit again a minute later. I changed one line for v1.1 and ran the same attack. This time the blackhole stayed on for the full 49 minutes and only came off after I stopped the flood.
I went in thinking detection would be the hard bit, but it wasn't. Knowing when the attack had actually finished was much harder than I expected

root@NOC:~# python3 /root/detect.py
Detector running. Baseline warms up after 5 minutes. Ctrl+C to stop.
*** ALERT: Customer A (C-001), 10.0.2.10: 0.6 Mbps, 100% from AS65001, 4683x baseline 1
Blackhole 10.0.2.10/32 via RTBH? [y/N] y
*** RTBH ANNOUNCED: 10.0.2.10/32, 11s after alert 2
   ⋮
202610061312 10.0.2.10       0.060 Mbps  trigger 0.20  reset 0.01  http UP   ALERT (quiet 0/5) 3
202610061313 10.0.2.10       0.060 Mbps  trigger 0.20  reset 0.01  http UP   ALERT (quiet 0/5)
202610061314 10.0.2.10       0.061 Mbps  trigger 0.20  reset 0.01  http UP   ALERT (quiet 0/5)
   ⋮  11 more minutes at ~0.06 Mbps, every one quiet 0/5
202610061326 10.0.2.10       0.120 Mbps  trigger 0.20  reset 0.01  http UP   ALERT (quiet 0/5) 4
   ⋮  22 more minutes at ~0.06 Mbps, every one quiet 0/5
202610061349 10.0.2.10       0.061 Mbps  trigger 0.20  reset 0.01  http UP   ALERT (quiet 0/5)
202610061350 10.0.2.10       0.061 Mbps  trigger 0.20  reset 0.01  http UP   ALERT (quiet 0/5)
202610061351 10.0.2.10       0.060 Mbps  trigger 0.20  reset 0.01  http UP   ALERT (quiet 0/5)
202610061352 10.0.2.10       0.050 Mbps  trigger 0.20  reset 0.01  http UP   ALERT (quiet 0/5)
202610061353 10.0.2.10       0.001 Mbps  trigger 0.20  reset 0.01  http UP   ALERT (quiet 1/5) 5
202610061354 10.0.2.10       0.001 Mbps  trigger 0.20  reset 0.01  http UP   ALERT (quiet 2/5)
202610061355 10.0.2.10       0.001 Mbps  trigger 0.20  reset 0.01  http UP   ALERT (quiet 3/5)
202610061356 10.0.2.10       0.001 Mbps  trigger 0.20  reset 0.01  http UP   ALERT (quiet 4/5)
*** CLEARED: 10.0.2.10 below 0.01 Mbps for 5 min, RTBH withdrawn 6
202610061357 10.0.2.10       0.001 Mbps  trigger 0.20  reset 0.01  http UP   ok 7
root@NOC:~#
root@NOC:~# sqlite3 -header -column /root/ddos.db "SELECT * FROM events;"
at                   dst        event           detail
-------------------  ---------  --------------  -------------------------------------------------------------------------------------------
2026-10-05T21:07:04  10.0.2.10  ALERT           Customer A (C-001), 10.0.2.10: 0.6 Mbps, 100% from AS65001, no baseline yet (floor trigger)
2026-10-05T21:07:37  10.0.2.10  RTBH ANNOUNCED  10.0.2.10/32, 33s after alert
2026-10-05T21:13:08  10.0.2.10  CLEARED         10.0.2.10 below 0.10 Mbps for 5 min, RTBH withdrawn
2026-10-05T21:14:09  10.0.2.10  ALERT           Customer A (C-001), 10.0.2.10: 0.4 Mbps, 100% from AS65001, 149x baseline
2026-10-06T12:21:03  10.0.2.10  ALERT           Customer A (C-001), 10.0.2.10: 0.6 Mbps, 100% from AS65001, 298x baseline
2026-10-06T12:21:36  10.0.2.10  RTBH ANNOUNCED  10.0.2.10/32, 33s after alert
2026-10-06T12:28:06  10.0.2.10  CLEARED         10.0.2.10 below 0.10 Mbps for 5 min, RTBH withdrawn
2026-10-06T13:09:09  10.0.2.10  ALERT           Customer A (C-001), 10.0.2.10: 0.6 Mbps, 100% from AS65001, 4683x baseline
2026-10-06T13:09:20  10.0.2.10  RTBH ANNOUNCED  10.0.2.10/32, 11s after alert
2026-10-06T13:58:06  10.0.2.10  CLEARED         10.0.2.10 below 0.01 Mbps for 5 min, RTBH withdrawn
root@NOC:~#
Nathan House. (October 2026). DDoS Statistics 2026: Attack Data, Records & Trends. [Online]. Station X. Last Updated: October 2026. Available at: https://app.stationx.net/articles/ddos-statistics [Accessed 6 October 2026].